 |
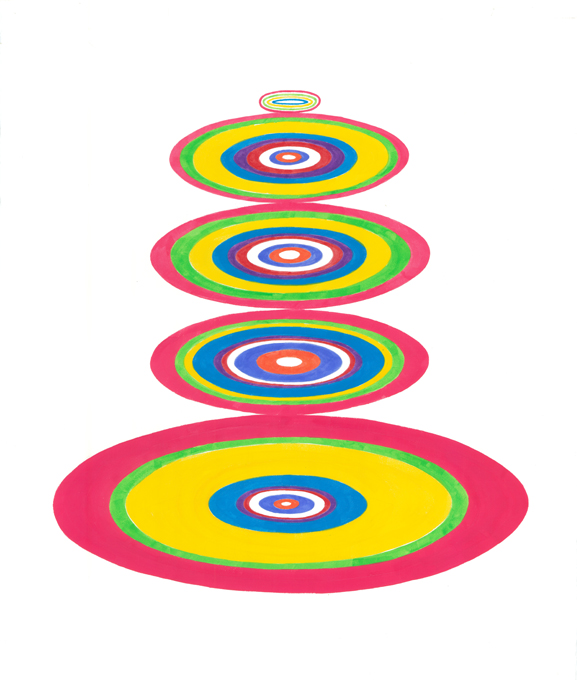
Stupa Paintings (Meat Exports) - 2011
Gouache on paper, 22"x27"
NOTES:
Stupa rings represent the quantity of meat exports for six South East Asian countries for ten years (1999-2009). The six ovals represent countries listed from top to bottom: Philippines, Malaysia, Indonesia, Singapore, Vietnam, and Thailand.
Source:
Trade Competitiveness Map: Analyse country and product competitiveness with trade flows. (n.d.). Retrieved May 1, 2011, from http://legacy.intracen.org/appli1/TradeCom/RS_TP_CI.aspx?RP=764&YR=2009 |
| |
| |
|
|
 |
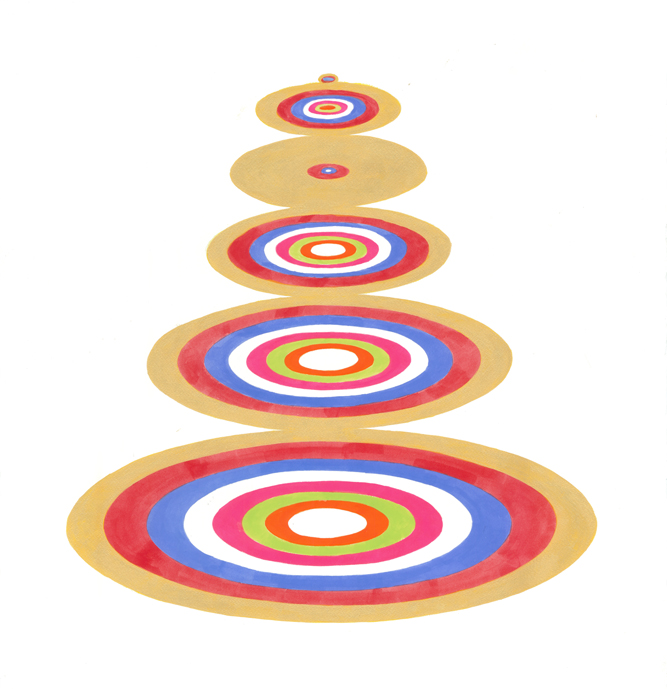
Stupa Paintings (Thailand Exports) - 2011
Gouache on paper, 22"x27"
NOTES:
Stupa rings represent the quantity of Thailand exports to five other South East Asian countries for nine years (2000-2009). From the top: Brunei, Myanmar, Cambodia, Laos, and Philippine.
Source:
Trade Competitiveness Map: Analyse country and product competitiveness with trade flows. (n.d.). Retrieved May 1, 2011, from http://legacy.intracen.org/appli1/TradeCom/RS_TP_CI.aspx?RP=764&YR=2009 |
| |
| |
| |
| |
 |
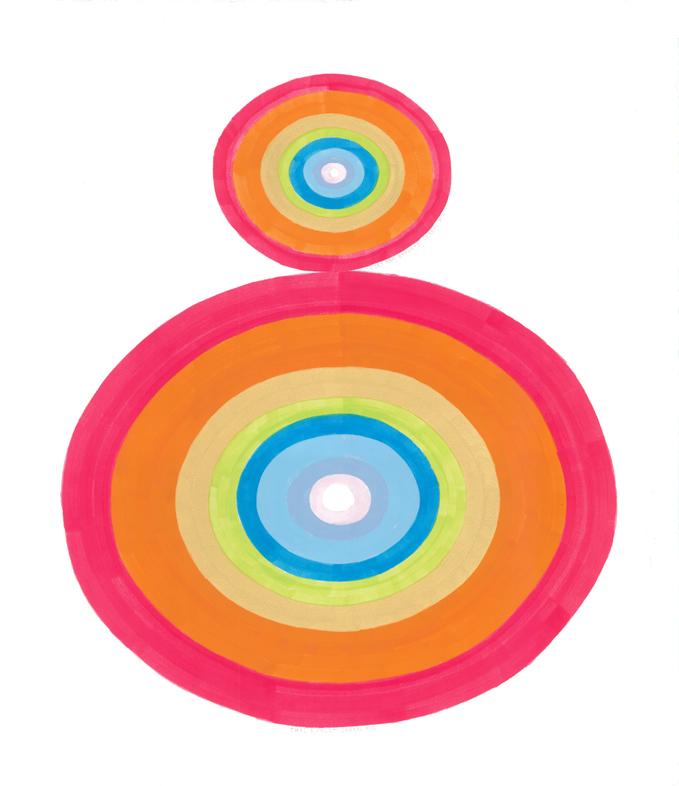
Stupa Paintings (Rice Exports) - 2011
Gouache on paper, 22"x27"
NOTES:
Stupa rings represent the quantity of rice exports for Vietnam (top) and Thailand (bottom) for nine years (2001-2009).
Source:
Trade Competitiveness Map: Analyse country and product competitiveness with trade flows. (n.d.). Retrieved May 1, 2011, from http://legacy.intracen.org/appli1/TradeCom/RS_TP_CI.aspx?RP=764&YR=2009 |
| |
| |
| |
| |
| |
 |
Stupa Paintings (Meat Imports) - 2011
Gouache on paper, 22"x27"
NOTES:
Stupa rings represent the quantity of meat imports for six South East Asian countries for seven years (2004-2010). The six ovals represent countries listed from top to bottom: Thailand, Indonesia, Vietnam, Philippines, Malaysia, and Singapore.
Source:
Trade Competitiveness Map: Analyse country and product competitiveness with trade flows. (n.d.). Retrieved May 1, 2011, from http://legacy.intracen.org/appli1/TradeCom/RS_TP_CI.aspx?RP=764&YR=2009 |
| |
| |
| |
| |
| |
| |
| |
| |
| |
| |
| |
| |
| |
| |
| |
| |
| |
| |
| |
| |
| |
| |
| |
| |
| |
| |
| |
| |
| |
|
|


