Brian
Bulfer
OWS:
PROJECTS: æ | TC Tuition | Prayer Flags | Sared Exchange | 3D Memory | Feng Shui Clock | OWS | Decline | Diamond Dust | Thai Trade | Diet Lingam | Data Paintings | Econ Drawings | Peaking | ... CATEGORIES: Drawings | Paintings | Sculptures | Prints | Photo-Mixed Media | Videos | Animations | Murals | Installations | 3D Prints | Collaborations | Artist-Based Research |
 |
|
Brian Bulfer - 2012 |
|
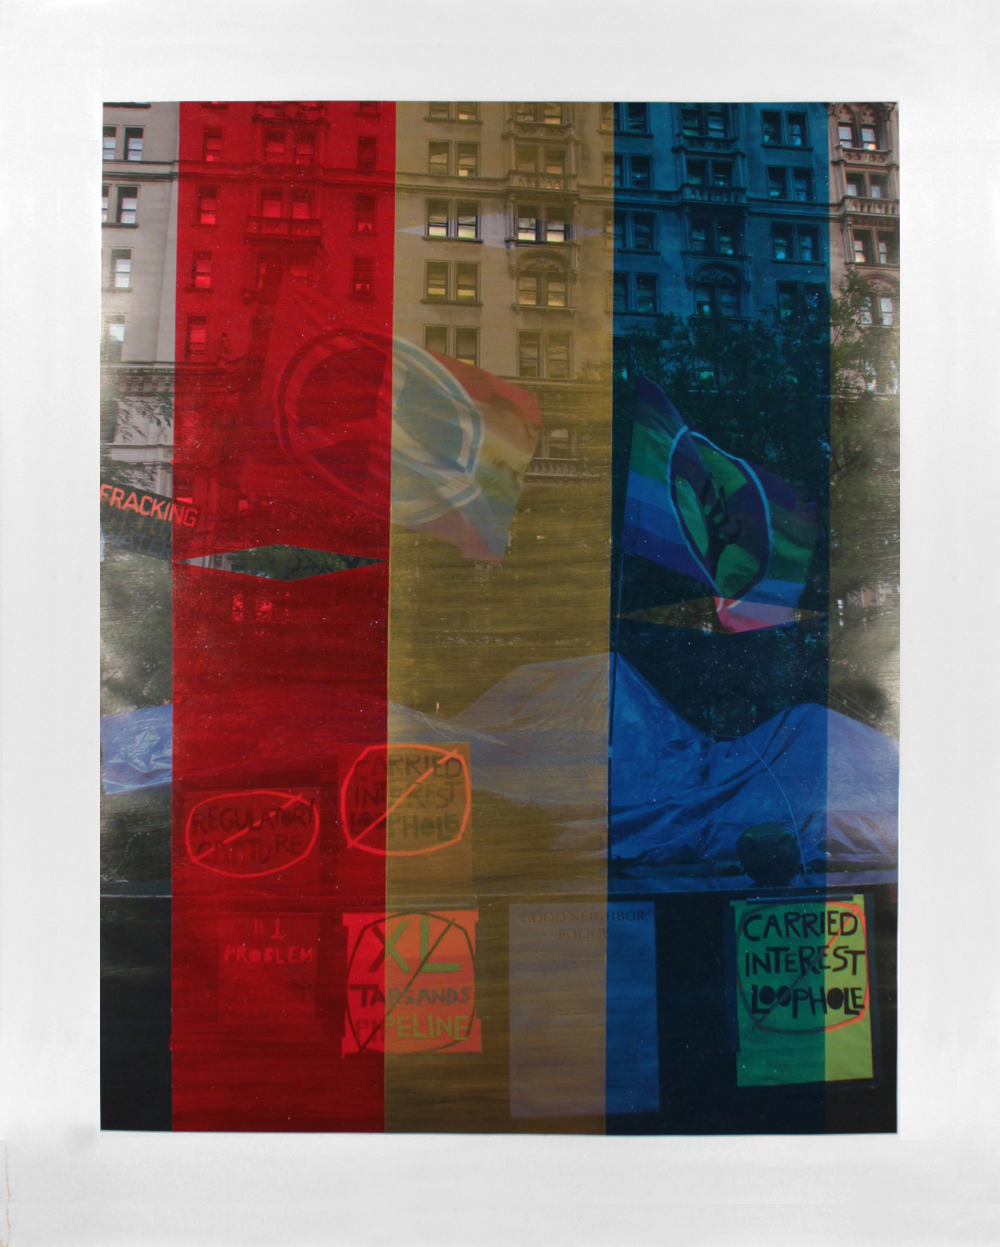
NOTES: Image taken from Wall Street, NY. Shape covering the image is a data visualization of the donations given to the Occupy Wall Street Movement between October 1st and December 13th 2011. Source: Elliott, J. (2011, December 15). Donations to occupy wall street plummet. Retrieved from http://www.salon.com/2011/12/15/donations_to_occupy_wall_street_plummet/ |
|
 |
|
Brian Bulfer - 2012 |
|
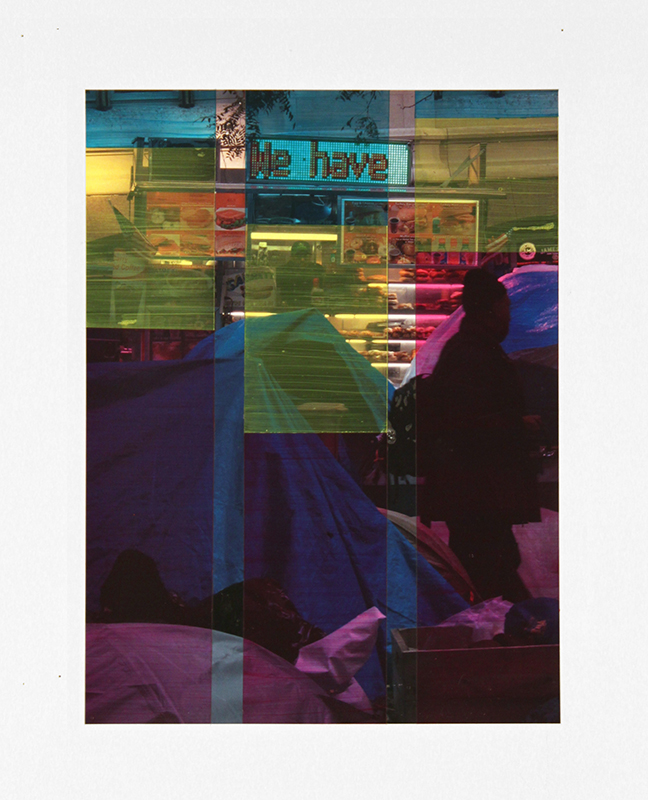
NOTES: Image taken from Zuccotti Park, NY during the Occupy Wall Street Movement. Diamonds represent the fluctuation of the Gross Domestic Product for three of the largest economic forces (the European Union, the US and China). The height of each diamond represents the stock value for three of the largest media corporations (Bertelsmann, General Electric and Beijing Media Corporation) for 2010. Source: MSN. (2013, September 15). MSN Money. Retrieved from http://money.msn.com/stocks/ |
|
 |
|
Brian Bulfer - 2012 |
|
NOTES: Image taken from Zuccotti Park, NY during the Occupy Wall Street Movement. Bar graph represents the Top 1%, 9% and the Bottom 90% of the US population in terms of Principal Residence, Life Insurance and Debt. Source: Domhoff, W. (2010, December). Who Rules America?. Retrieved from http://www2.ucsc.edu/whorulesamerica/power/wealth-new.html |
|
 |
|
| Brian Bulfer - 2012 Business Equity, Financial Securities, Trusts, Stocks and Mutual Funds, and Non-Home Real Estate acrylic on print, 16" x 13" |
|
NOTES: Image taken from Zuccotti Park, NY during the Occupy Wall Street Movement. Bar graph represents the Top 1%, 9% and the Bottom 90% of the US population in terms of Business Equity, Financial Securities, Trusts, Stocks and Mutual Funds, and Non-Home Real Estate. Source: Domhoff, W. (2010, December). Who rules america?. Retrieved from http://www2.ucsc.edu/whorulesamerica/power/wealth-new.html |
|