Brian
Bulfer
Decline of Art Education 1930 to 2010:
PROJECTS: æ | TC Tuition | Prayer Flags | Sared Exchange | 3D Memory | Feng Shui Clock | OWS | Decline | Diamond Dust | Thai Trade | Diet Lingam | Data Paintings | Econ Drawings | Peaking | ... CATEGORIES: Drawings | Paintings | Sculptures | Prints | Photo-Mixed Media | Videos | Animations | Murals | Installations | 3D Prints | Collaborations | Artist-Based Research |
 |
|
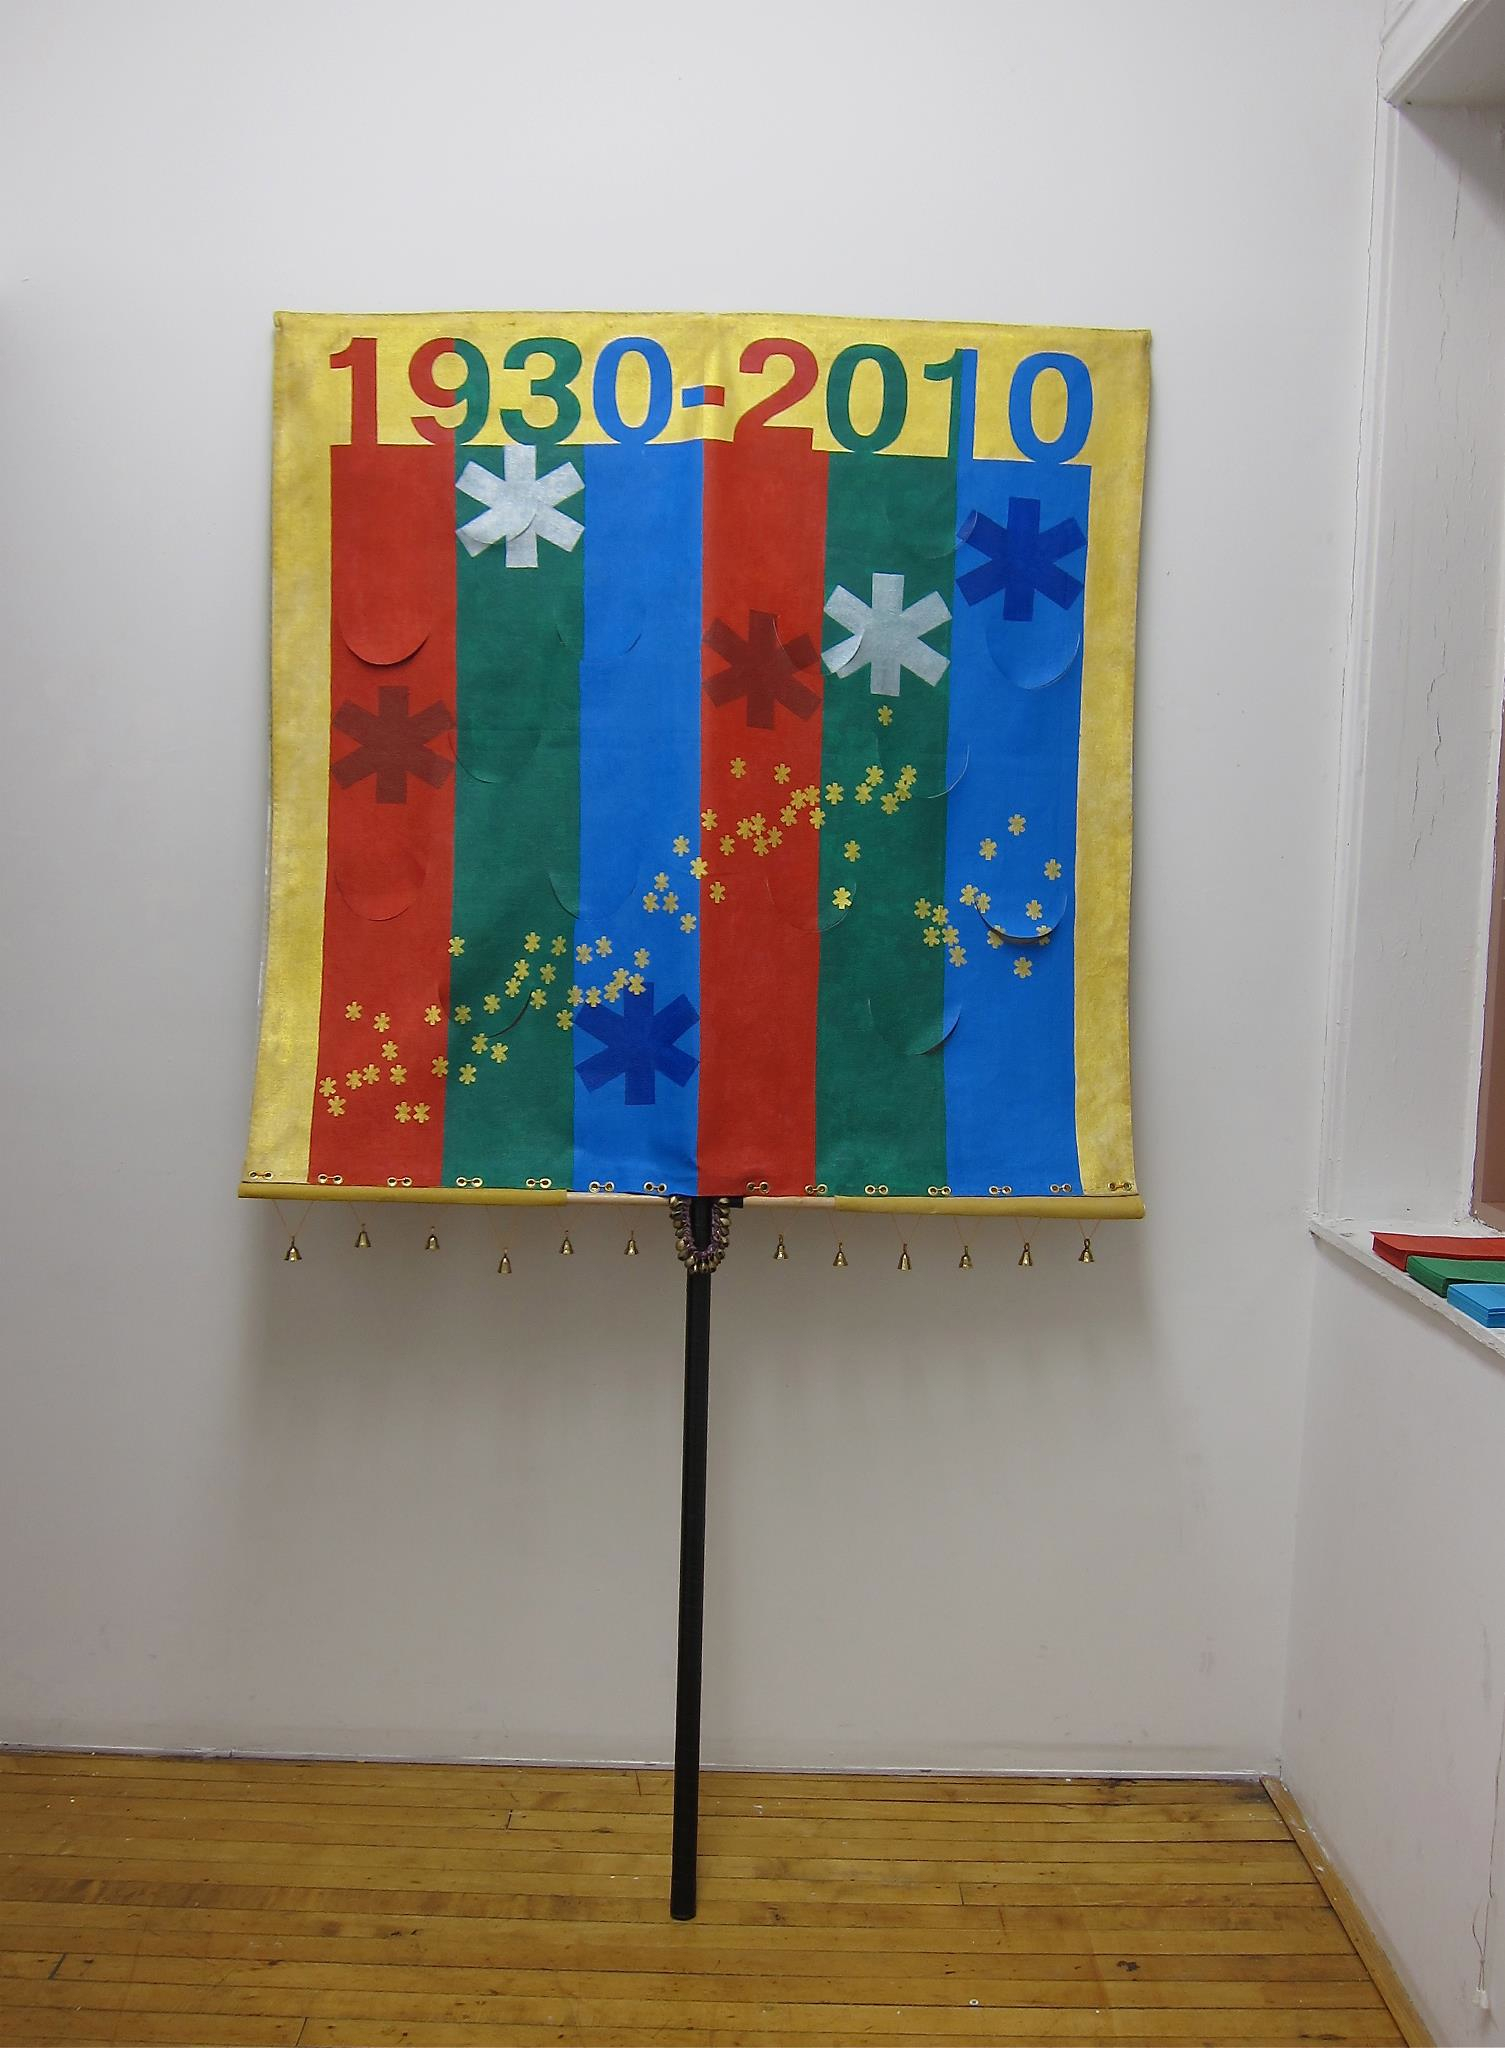
Decline of Art Education 1930 to 2010, Washington DC 2012 |
|
Notes: Decline of Art Education 1930 to 2010 represents government spending for three priority departments, along with a graph showing how much art education adults report receiving as children. The project is primarily concerned with the importance art plays in education, the learning process and our social lives. This sign, reflecting a period of 80 years, has two sides. The RGB color model (TV and computer imaging primaries) is used as a basic yet contemporary form of information representation. On the back, the Federal budget for defense, education and health care for the years 1930 and 2010 are represented in separate silver cells. Defense comprised 37% in 1930 and 25% in 2010; education comprised 1% in 1930 and 4% in 2010; health care comprised 3% in 1930 and 24% in 2010. On the front, asterisks (often used as a form of censorship, but also appearing to be stars or gears in a machine) graph the total US spending (Federal, State and local) % for defense, education and health care for 1930 and 2010. Defense was 12% in 1930 and 14% in 2010; education was 19% in 1930 and 15% in 2010; health care was 4% in 1930 and 17% in 2010. Along the front, golden asterisks represent the rise and gradual fall of adults that report receiving art education as children between 1930 and 2010.
|
|
Sources: Rabkin, N., & Hedberg, C. (2008) Arts Education in America: What the Declines Mean for Arts Participation. National Endowment for the Arts. Chicago, IL: NORC University of Chicago |
|
Bicentennial Edition: Historical Statistics of the US: The 2012 Statistical Abstract. Earlier Editions. Retrieved August 10, 2012 from http://www.census.gov/compendia/statab/past_years.html |
|
State and Local Gov. Finances Summary: State & Local Government Finance - Business & Amp; Industry. Retrieved August 10, 2012 from http://www.census.gov/govs/estimate/. |
|
US Gov. Budget: Hist. Tables 3.2 and 7.1: FDsys - Browse BUDGET. FDsys - Browse BUDGET. Retrieved August 10, 2012 from http://www.gpo.gov/fdsys/browse/collection.action?collectionCode=BUDGET. |
|
|
|
 |
|
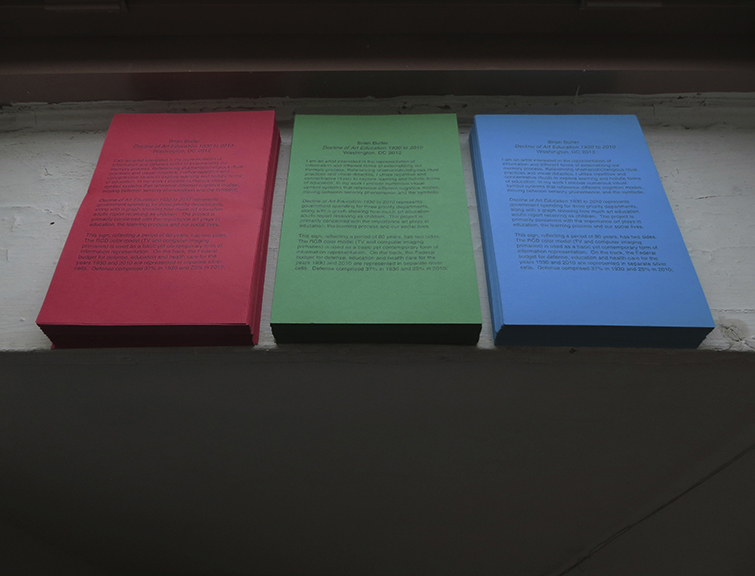
Decline of Art Education 1930 to 2010, Washington DC 2012 |
|
| (Notes Coming Soon) | |
 |
|
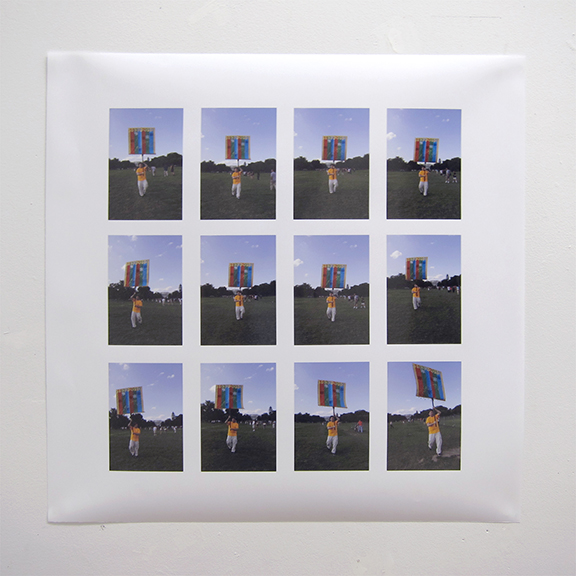
| Decline of Art Education 1930 to 2010, Washington DC 2012 | |
| (Notes Coming Soon) - Photos taken by Patricia Brace | |
 |
|
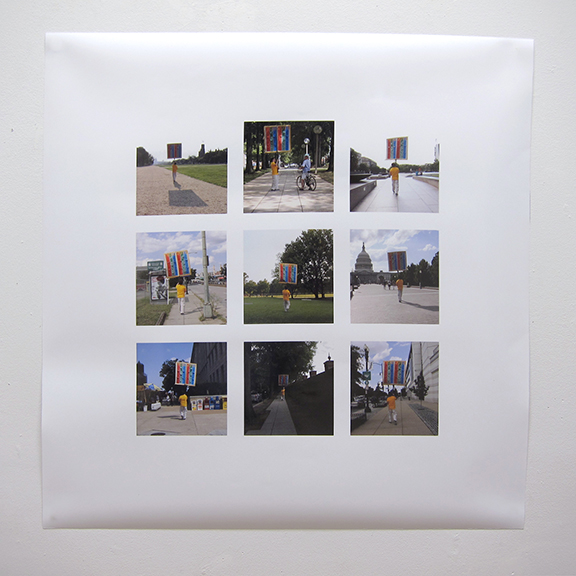
| Decline of Art Education 1930 to 2010, Washington DC 2012 | |
| (Notes Coming Soon) Photos taken by Patricia Brace | |