Brian
Bulfer
Thai Trade:
PROJECTS: æ | TC Tuition | Prayer Flags | Sared Exchange | 3D Memory | Feng Shui Clock | OWS | Decline | Diamond Dust | Thai Trade | Diet Lingam | Data Paintings | Econ Drawings | Peaking | ... CATEGORIES: Drawings | Paintings | Sculptures | Prints | Photo-Mixed Media | Videos | Animations | Murals | Installations | 3D Prints | Collaborations | Artist-Based Research |
Thai Trade Projects: King's Room Classroom | King's Room Dining Room | Water Tower | Trade Stupas
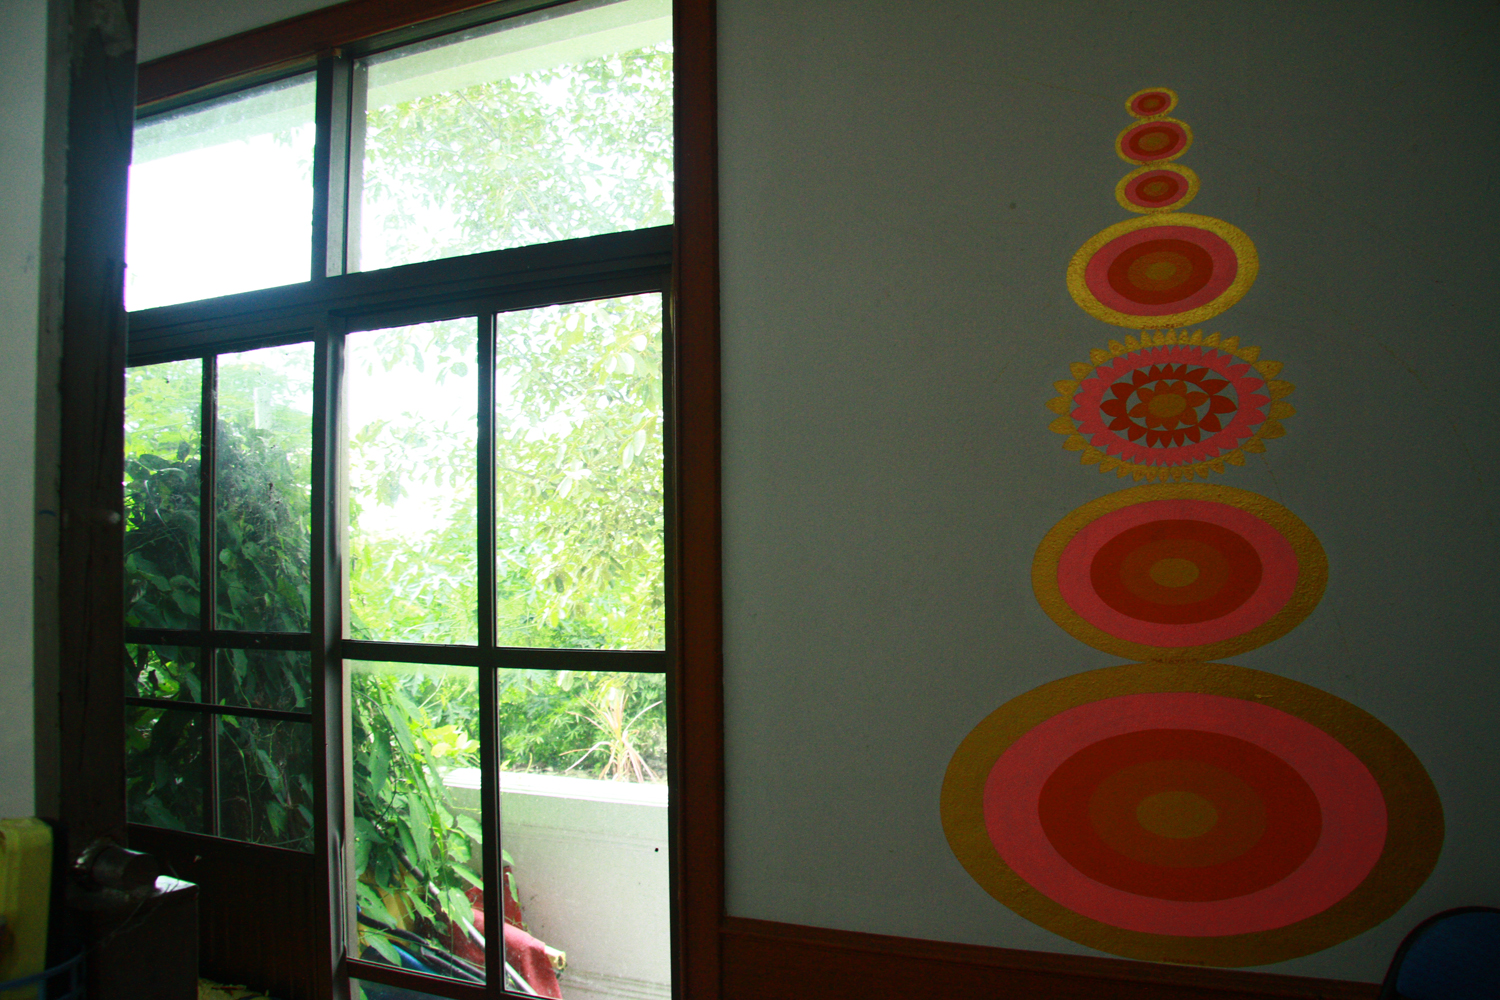
| King's Room (Classroom), 2011 | |
 |
|
Hill Top Temple in Chiang Mai, Doi Saket, Thailand acrylic on wall 2.5' x 5' NOTES: The size of each oval represents the comparative number of exports for Cambodia, Philippines, Vietnam, Indonesia, Thailand (lotus pedals), Malaysia and Singapore at the bottom. Each ring represents the year starting from the middle at 2005 (grass), 2006 (saffron), 2007 (deep saffron), 2008 (florescent pink) and 2009 (gold) Source: Trade Competitiveness Map: Analyse country and product competitiveness with trade flows. (n.d.). Retrieved May 1, 2011, from http://legacy.intracen.org/appli1/TradeCom/RS_TP_CI.aspx?RP=764&YR=2009> |
|
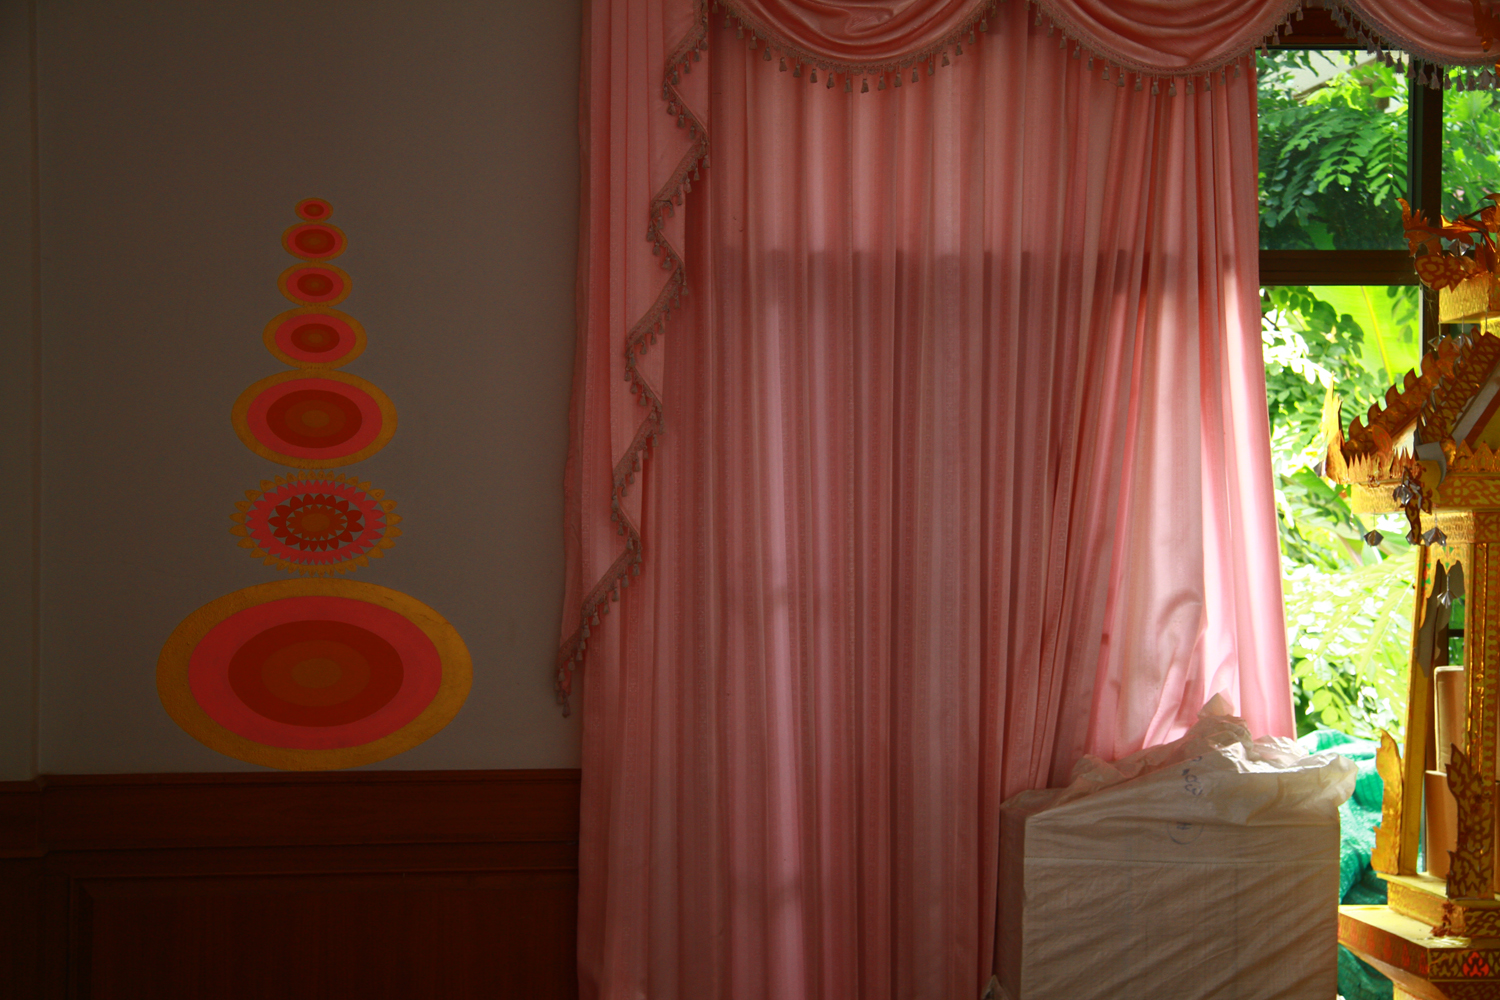
| King's Room (Dining Room), 2011 | |
 |
|
Hill Top Temple in Chiang Mai, Doi Saket, Thailand acrylic on wall 2.5' x 5' NOTES: The size of each oval represents the comparative number of imports for Cambodia, Philippines, Vietnam, Indonesia, Malaysia, Thailand (lotus pedals), and Singapore at the bottom. Each ring represents the year starting from the middle at 2005 (grass), 2006 (saffron), 2007 (deep saffron), 2008 (florescent pink) and 2009 (gold). Source: Trade Competitiveness Map: Analyse country and product competitiveness with trade flows. (n.d.). Retrieved May 1, 2011, from http://legacy.intracen.org/appli1/TradeCom/RS_TP_CI.aspx?RP=764&YR=2009 |
|
| Water Tower Project, 2011 | |
.jpg) |
|
Hill Top Temple in Chiang Mai, Doi Saket, Thailand acrylic on concret wall 14' x 9' NOTES: The size of each circle or oval represents data concerning renewable water resources. Each ring represents the land area (the wall), water area (navy blue), population (dark pastel green), imports (sky blue) and exports (gold) of cereal products and imports (auburn) and exports (florescent pink) of meat products for Thailand, Burma, Vietnam, the Philippines, Malaysia and Indonesia. Source: Trade Competitiveness Map: Analyse country and product competitiveness with trade flows. (n.d.). Retrieved May 1, 2011, from http://legacy.intracen.org/appli1/TradeCom/RS_TP_CI.aspx?RP=764&YR=2009 The World Factbook. (n.d.). Retrieved December 1, 2009, from https://www.cia.gov/library/publications/the-world-factbook/ |
|
| Trade Stupas, 2011 | |
 |
|
Stupa Paintings Series - 2011 Gouache on paper, 22"x27" NOTES: Stupa rings represent the quantity of meat exports for six South East Asian countries for ten years (1999-2009). The six ovals represent countries listed from top to bottom: Philippines, Malaysia, Indonesia, Singapore, Vietnam, and Thailand. Source: Trade Competitiveness Map: Analyse country and product competitiveness with trade flows. (n.d.). Retrieved May 1, 2011, from http://legacy.intracen.org/appli1/TradeCom/RS_TP_CI.aspx?RP=764&YR=2009 |
|